Last Fact-Checked: April 28, 2026 | 10 min read | Science / Atmosphere | Vella Team
Most people view the sky as a static background, assuming the world’s significant events happen only on the ground. It is a reasonable assumption. The sky does not move in any way that feels urgent. It does not invoice you. It does not send notifications.
But that stillness is a misread. The sky is a physical system moving energy across the planet — and it has been doing so continuously, silently, since long before anything on the surface learned to look up. These five phenomena are not separate curiosities. They are five different outputs of one system, each one reflecting the state of the atmosphere at that moment.
On March 13, 1989, a geomagnetic storm knocked out the power grid serving large parts of Quebec in under 92 seconds. Six million people lost electricity for nine hours. The sky that night was green, vivid, and spectacular. Few observers standing beneath it likely understood the scale of what they were watching.
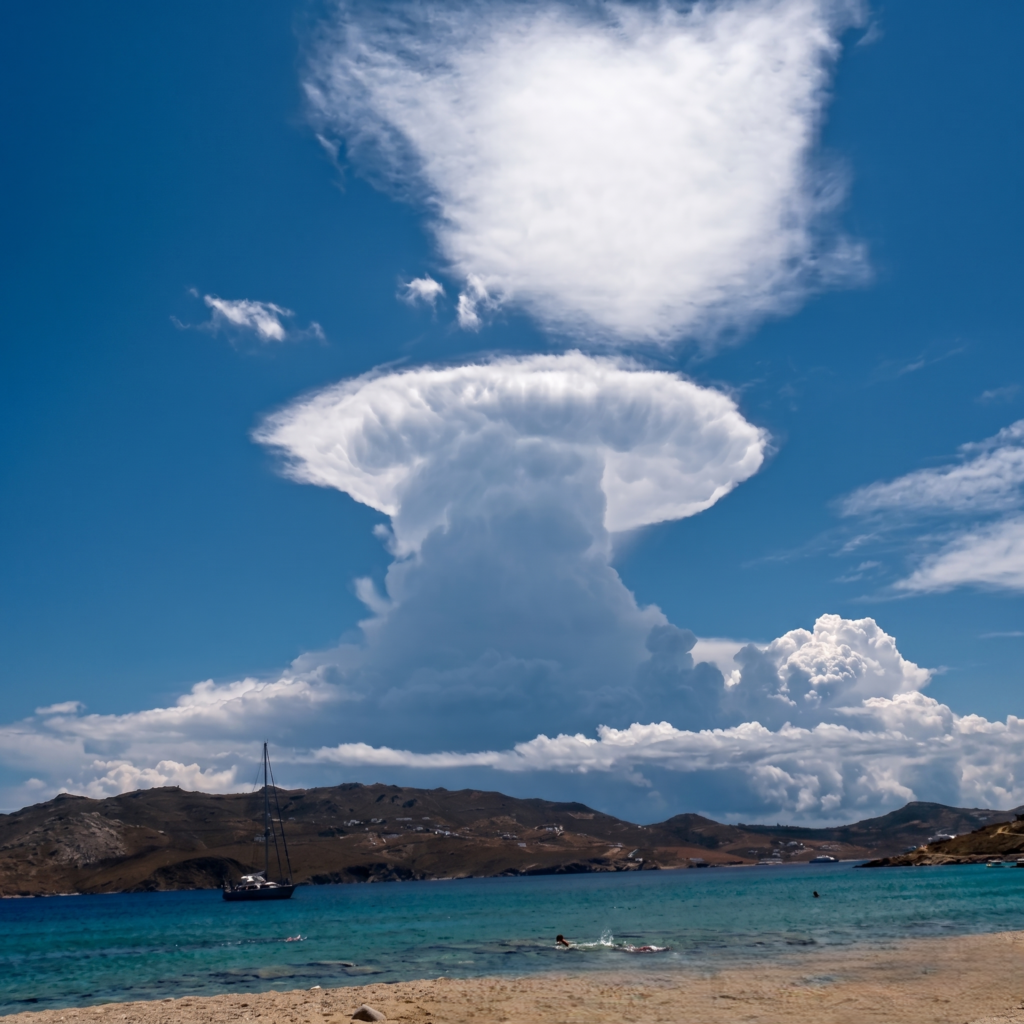
A cumulonimbus cloud develops an anvil top over a Mediterranean coastline, its flat cap formed where the rising tower met the stratospheric boundary — a record of atmospheric energy hitting its ceiling. Source: Wikimedia Commons / Public Domain
A Cloud That Reaches the Edge of the Weather Layer
The structure in the first image is not dramatic by accident. A cumulonimbus cloud begins when surface air heats faster than the air above it, becomes less dense, and starts rising. Think of it like a pot of water beginning to boil — the hottest water at the bottom pushes upward, and cooler water presses down in response. The atmosphere does the same thing, but the scale is different. Updrafts inside a mature cumulonimbus can exceed 150 kilometers per hour. The NOAA National Severe Storms Laboratory documented velocities surpassing 175 kilometers per hour in supercell events recorded between 2010 and 2022, with cloud tops penetrating the lower stratosphere in the most extreme cases.
As the column rises, moisture condenses and releases latent heat. That heat adds buoyancy. The process feeds itself, driving the tower upward until it hits the tropopause — the hard boundary between the troposphere and the stratosphere, sitting roughly 12 kilometers above sea level at mid-latitudes. At that ceiling, the air spreads outward and forms the flat anvil shape visible in the photograph. Pilots recognize that shape from a long distance. It means the air beneath it is not safe. Inside the tower, ice particles collide at high velocity, separating electrical charge across vertical distance. When the charge differential exceeds the insulating capacity of air, it discharges. A lightning bolt heats a narrow channel of atmosphere to approximately 30,000 Kelvin in milliseconds — hotter than the surface of the sun.
This is not a weather event in the casual sense. It is a heat engine doing what heat engines do: converting thermal energy into motion, electrical discharge, and eventually rain. The same physics operates at smaller scales every single afternoon in tropical regions, feeding energy upward into a system most people never think about — until the system has something to say.
Light That Breaks Apart and Shows You What It Carried
The second image requires a correction. What appears to be a conventional rainbow rising from the mountain peak is more precisely a circumzenithal arc — produced not by liquid water droplets but by hexagonal plate-shaped ice crystals suspended in high-altitude cirrus cloud. The distinction matters. A standard rainbow requires liquid water and appears as an arc centered on the point directly opposite the sun. The circumzenithal arc requires ice at altitude and appears in a completely different part of the sky, produced by refraction through the flat faces of ice crystals rather than internal reflection inside droplets.
Both phenomena rest on the same physics: light separates by wavelength when it passes through a medium that bends different frequencies at slightly different angles. Red light, at a wavelength of approximately 700 nanometers, bends the least. Violet, at around 400 nanometers, bends the most. The separation is not decorative — it is a precise fingerprint of the electromagnetic spectrum, written across the sky in spatial form. Like a prism on a windowsill spreading white light into a band of color across a wall, the atmosphere is performing the same operation at altitude, across kilometers, using ice crystals a fraction of a millimeter in diameter.
The NOAA Atmospheric Optics research program has documented over 40 distinct optical phenomena that operate on this principle — halos, arcs, glories, coronae — most of which pass unnoticed above populated areas every single day. The sky reflects its physical composition continuously. Altitude, temperature, crystal orientation, particle density — all of it is encoded in light, the way a glass of water held up to a lamp reveals whether it is clear or cloudy without needing to be tested. The question is not whether the information is there. The question is whether anyone has learned to read it.
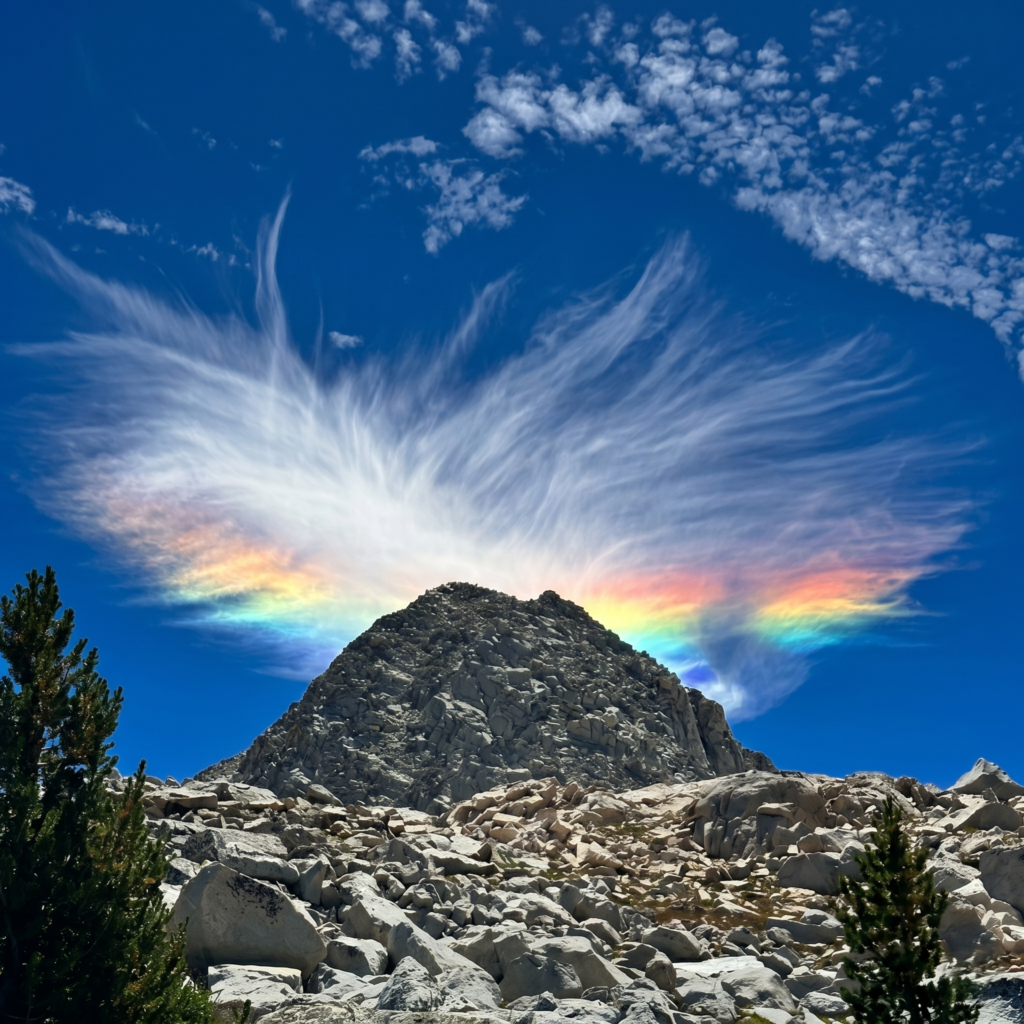
A circumzenithal arc above a granite peak in the Sierra Nevada, produced by sunlight refracting through horizontally oriented hexagonal ice crystals in cirrus cloud — visible only when the sun sits below 32 degrees above the horizon. Source: Wikimedia Commons / CC BY-SA 4.0
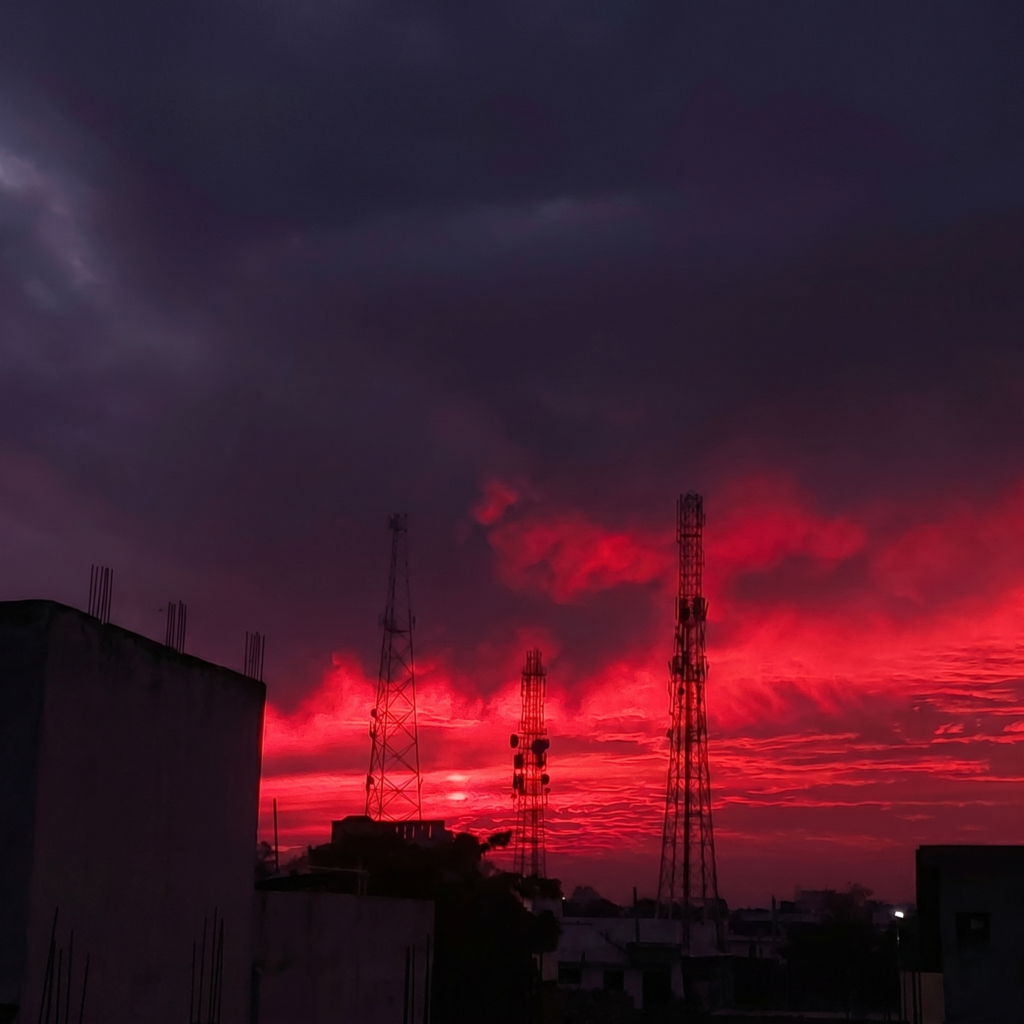
A deep red sunset over an urban skyline — the crimson saturation produced by Rayleigh scattering stripping shorter wavelengths from sunlight traveling through a long, low-angle atmospheric path. Source: Wikimedia Commons / CC BY-SA 4.0
Red Is What Survives the Longest Path
The third image does not show a fire. It shows what happens when sunlight runs out of options. When the sun sits low on the horizon, its light must travel through a far greater thickness of atmosphere to reach an observer — sometimes 40 times the path length of midday light, according to calculations published by the NOAA Earth System Research Laboratories. That additional distance is not neutral. Every kilometer of atmosphere is another filter.
Atmospheric molecules scatter shorter wavelengths more efficiently than longer ones. This relationship — Rayleigh scattering, first quantified by physicist John William Strutt in 1871 — means blue light loses its fight early. It scatters outward in every direction and spreads across the whole sky. By the time sunlight has completed a long low-angle journey to the observer, the blue component is largely gone. What arrives is predominantly red and orange — the longer wavelengths that endured. The clouds in the image are not lit from below. They are catching what remains of light that has already been stripped of everything else.
The intensity of a red sky tells you something specific. After the Krakatoa eruption in 1883, stratospheric sulfur dioxide particles enhanced scattering so severely that crimson sunsets were documented as far away as Norway for months. Wildfire smoke performs the same function. A sky that is unusually red is not just atmospheric physics — it is a record of what the air has been carrying. That information arrives quietly, on the horizon, in a color most people photograph without reading.
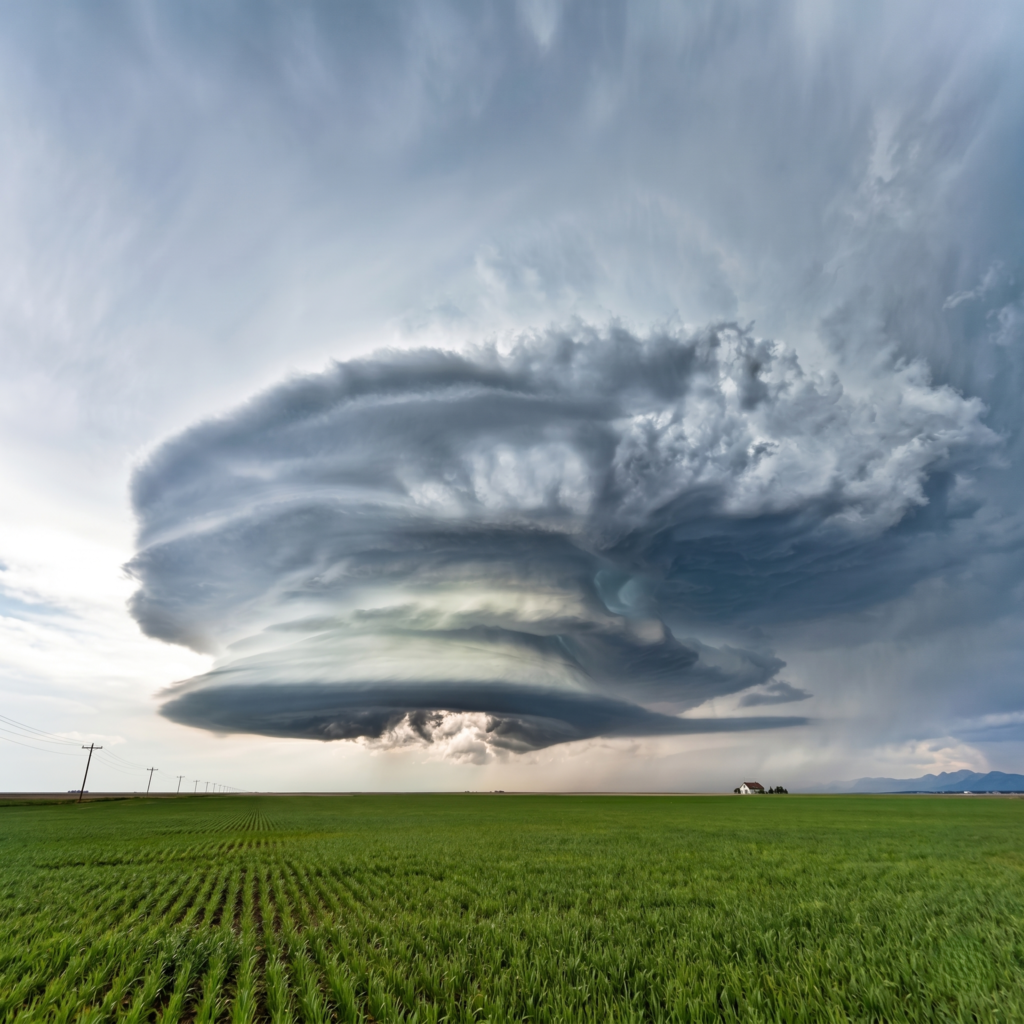
A supercell thunderstorm over agricultural flatland, its layered rotation bands revealing the mesocyclone structure responsible for the majority of violent tornadoes documented across the North American Great Plains. Source: Wikimedia Commons / CC BY-SA 4.0
The Storm That Builds Its Own Architecture
The fourth image is a supercell thunderstorm — not yet a tornado, and that distinction is important. A supercell is a rotating thunderstorm in which the entire updraft column has developed persistent, organized spin. That rotation is driven by vertical wind shear: horizontal layers of wind moving at different speeds or directions, which tilt rotating air masses from horizontal to vertical as they are pulled into the storm’s updraft. The layered, sculpted appearance in the photograph is the visible record of that rotation. Each band represents air being drawn into the storm at a different altitude and velocity, compressed and organized by the same thermodynamic pressure driving every other phenomenon described here.
Supercells are responsible for nearly all significant tornadoes documented across the United States. The NOAA Storm Prediction Center recorded 1,376 confirmed tornadoes in 2023 alone, the majority associated with supercell activity in the Great Plains corridor. Wind speeds inside the most intense tornadoes — classified EF5 on the Enhanced Fujita scale — exceed 320 kilometers per hour. The 2011 Joplin, Missouri tornado killed 158 people and carved a damage path 35 kilometers long and nearly a kilometer wide. The pressure at the center of an active tornado drops so rapidly that structures do not simply collapse — the pressure differential between inside and outside can be violent enough to pull a building apart from within.
What this means for anyone standing at a distance, watching that formation, is simple: the same atmospheric instability that creates the visual architecture of a beautiful storm does not show a clear upper limit from ground observation alone. The energy budget that produces a spectacular rotating cloud contains, under slightly different conditions, the most destructive wind event the atmosphere generates. The distance between those two outcomes is not visible from the ground. This raises a direct question worth sitting with: when we observe a storm system and judge it by appearance, how much of what we are seeing is information, and how much is simply weather doing what weather does regardless of who is watching?
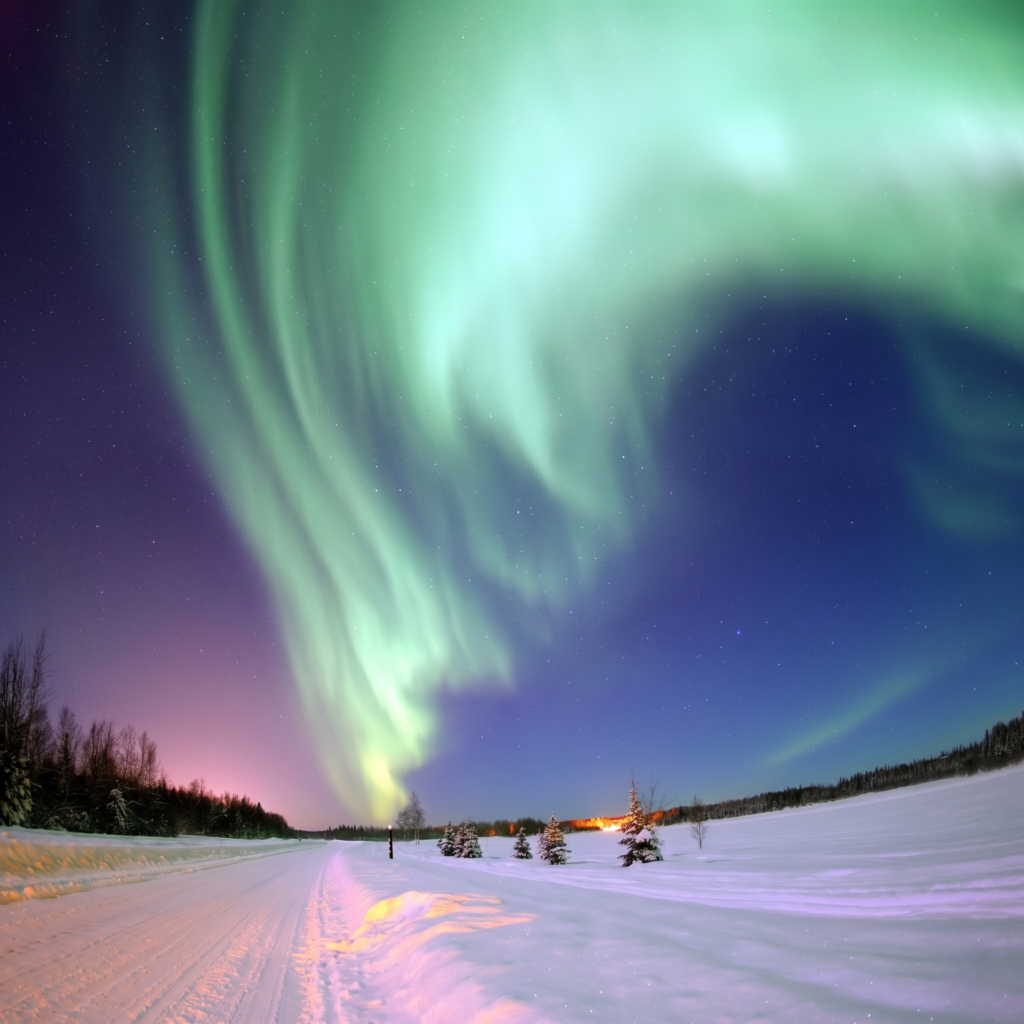
Aurora borealis over a snow-covered boreal landscape in Alaska, its green and violet bands produced by solar particle collisions with oxygen and nitrogen molecules at altitudes between 100 and 300 kilometers. Source: NASA / Public Domain
The Aurora Is Not a Light Show — It Is a Status Report
The fifth image benefits from a different perspective. The aurora borealis is one of the most photographed natural phenomena on Earth. It is also one of the most systematically misunderstood — not because the science is obscure, but because the visual experience of standing beneath it tends to silence every practical question a person might otherwise ask.
An aurora begins at the sun. The solar surface continuously emits a stream of charged particles — the solar wind — and periodically releases coronal mass ejections, or CMEs, carrying billions of tons of magnetized plasma toward Earth at speeds between 500 and 3,000 kilometers per second. Earth’s magnetic field deflects most of this material. At the polar regions, where field lines converge and dip toward the surface, some particles funnel downward into the upper atmosphere. At altitudes between 100 and 300 kilometers, these particles collide with oxygen and nitrogen molecules, transferring energy that is released as light. Oxygen at lower altitudes emits green — the most common aurora color. Oxygen at higher altitudes emits red. Nitrogen produces blue and purple tones. The green light in the photograph is beautiful and chemically precise: it is the specific emission wavelength of atomic oxygen excited at approximately 100 kilometers altitude. The sky is telling you exactly what it is made of.
The practical consequence of that same process is less poetic. The 1989 Quebec blackout was caused by a geomagnetic storm rated Kp 9 — the maximum on NOAA’s Space Weather Prediction Center index. That same storm damaged transformers across North America and caused navigational errors in multiple satellites. But the 1989 event was not the largest on record. The Carrington Event of September 1859 — named after British astronomer Richard Carrington, who observed the solar flare directly — produced a geomagnetic storm so intense that telegraph systems across Europe and North America failed simultaneously, with some operators reporting that their equipment continued to transmit even after being disconnected from power sources. Auroras were visible as far south as Cuba and Hawaii. A comparable event striking today’s infrastructure, one built around GPS timing signals, high-frequency satellite communications, and long-distance high-voltage transmission, would carry consequences that a 2013 Lloyd’s of London risk analysis estimated between 0.6 and 2.6 trillion dollars in the United States alone. The green light that draws thousands of photographers to northern latitudes every winter is the visible edge of a geophysical process that has demonstrated, historically, the capacity to significantly disrupt modern infrastructure.
What the Sky Cannot Tell You on Its Own
Each phenomenon described here carries a limit worth stating directly. Atmospheric optics can tell you what is happening above you with considerable precision. It cannot tell you what will happen next. Cumulonimbus clouds do not always produce tornadoes. Geomagnetic storms do not always disrupt infrastructure. Red skies do not always indicate particulate loading. The visual appearance of the sky is a data point. It is not a forecast, and it was never designed to be one.
This is not a minor distinction. The history of meteorological science is partly a record of correcting intuitions that felt reliable but failed under conditions they were not built to handle. The “red sky at morning, sailor’s warning” maxim has genuine grounding — low-pressure systems tend to move eastward, and red morning skies suggest moisture-laden air arriving from the west. But it is a heuristic developed for a specific geography and a specific era, and it fails outside those parameters. Modern numerical weather prediction, run by NOAA’s National Centers for Environmental Prediction and equivalent agencies worldwide, replaced intuition with physics-based models drawing on real observational data updated continuously. The sky you see is the output of those models made visible. It is not the input, and treating it as one — drawing confident conclusions from a single visual phenomenon without the surrounding data — is a form of overconfidence that atmospheric scientists have spent decades working to correct.
The sky is a system. Watching one part of that system, in isolation, gives you partial information. This raises a fundamental question that the data does not resolve on its own: if the visual sky is an output rather than an input, and if the inputs are only accessible through instruments most people never consult, then the confidence with which people interpret what they see overhead is, in most cases, largely unfounded. The atmosphere does not care whether the partial information feels convincing.
Frequently Asked Questions
Q. Why does the aurora sometimes appear red instead of green?
A. Aurora color depends on which gas is excited and at what altitude. Oxygen above approximately 200 kilometers emits red light. Green aurora — the most commonly seen — comes from oxygen between roughly 100 and 150 kilometers altitude. Red auroras require higher-energy particle events to push excitation higher into the atmosphere. During the extreme geomagnetic storm of May 2024, red auroras were visible as far south as northern Africa and parts of Mexico, latitudes where the phenomenon is almost never observed. During the Carrington Event of 1859, red and white auroras were reported by observers in Cuba, Jamaica, and Hawaii — the most equatorial aurora sightings in the historical record.
Q. What separates a supercell from a regular severe thunderstorm?
A. A supercell is defined by persistent, organized rotation throughout its updraft column — a structure called a mesocyclone. Ordinary thunderstorms, even severe ones, lack this deep rotational organization. The rotation in a supercell is driven by vertical wind shear: horizontal layers of wind moving at different speeds or directions, which tilt air masses from horizontal to vertical as they are drawn into the updraft. The NOAA Storm Prediction Center classifies supercells as a distinct storm mode because they are responsible for a disproportionate share of large hail, damaging straight-line winds, and significant tornadoes relative to how frequently they occur. The May 20, 2013 Moore, Oklahoma tornado — which killed 24 people and carried peak winds of approximately 340 kilometers per hour — was produced by a supercell that meteorologists had tracked for over an hour before touchdown, a reminder that the visual warning and the physical event are separated by time as well as distance.
Q. Can a circumzenithal arc appear at any time of day?
A. No. The phenomenon requires the sun to be positioned below approximately 32 degrees above the horizon. When the sun is higher, the geometry of refraction through horizontal hexagonal ice plate crystals no longer directs light toward an observer’s position. It also requires cirrus cloud containing horizontally oriented plate crystals — common but not constant. These two constraints together mean circumzenithal arcs are most frequently visible in morning and late afternoon hours, and at higher latitudes where solar elevation angles remain lower for longer portions of the day.
What You Now Know
The sky is not a backdrop. It is a continuous physical record of what the planet’s energy budget, magnetic environment, and atmospheric chemistry are doing at this moment. The green aurora that draws photographers to northern latitudes every winter is the same process that took down a provincial power grid in 92 seconds. Knowing that does not make the light less striking. It makes it heavier — the way any beautiful thing becomes heavier when you understand what it is actually doing.
Tip For Readers
NOAA’s Space Weather Prediction Center publishes real-time geomagnetic storm alerts and aurora visibility forecasts at NOAA Space Weather Prediction Center. If you want to track when the sky is operating at its most intense — and most consequential — that is the most reliable place to start.
Verified Sources
NOAA National Severe Storms Laboratory — Thunderstorm Basics and Severe Weather Research, 2023
NOAA Earth System Research Laboratories — Atmospheric Optics and Rayleigh Scattering Documentation, 2022
NOAA Storm Prediction Center — Annual Tornado Statistics and Supercell Classification Report, 2023
NOAA Space Weather Prediction Center — Geomagnetic Storm Impacts and Aurora Science Overview, 2024
NOAA National Centers for Environmental Prediction — Numerical Weather Prediction Science Overview, 2022
Lloyd’s of London Emerging Risks Team — Solar Storm Risk to the North American Electric Grid, 2013
Image Credits
Some images in this piece are sourced from Wikimedia Commons and NASA open-access archives.
All images are used under their respective licenses, including CC BY-SA 4.0 and Public Domain.
Original creators are credited where applicable. Image sources can be verified via Wikimedia Commons and NASA Image and Video Library.
Aurora Borealis image: NASA / Public Domain. Cumulonimbus, supercell, sunset, and circumzenithal arc images: Wikimedia Commons contributors / CC BY-SA 4.0.