Lightning goes down. Everyone knows that. It’s wrong.
Above the clouds, something else is happening. Something that runs in the opposite direction. The atmosphere has been doing this for as long as storms have existed — in silence, at altitudes no aircraft reaches. The observer who first catches one, standing 300 kilometers from the storm in absolute darkness, does not immediately believe what they have seen. The chill that follows is not from the temperature.
On July 6, 1989, a low-light television camera operated by a University of Minnesota research team recorded a flash at approximately 60 kilometers altitude — 40 kilometers above the highest storm cloud, well beyond the reach of any commercial aircraft then or now. That footage was the first confirmed documentation of a phenomenon that pilots had been quietly reporting for decades and scientists had been quietly dismissing for just as long. The phenomenon is called a red sprite. And once you understand what it is, the word “lightning” will never sit comfortably in your mouth again.
The Sky Is Not One Space — It Has Floors
The cloud you shelter under during a storm sits in the troposphere, which extends roughly 12 kilometers above the surface. Above that is the stratosphere. Above that, the mesosphere — cold, thin, almost airless by any standard a human body would recognize. Red sprites occur in the mesosphere, between 40 and 90 kilometers altitude. The lower edge of a sprite event is still three to four times higher than a cruising commercial jet. The upper edge approaches the boundary where the atmosphere becomes indistinguishable from space.
The trigger is a positive cloud-to-ground lightning strike — a stroke that transfers positive charge from the base of the cloud into the earth, rather than the far more common negative transfer. According to research compiled by the American Geophysical Union, positive lightning accounts for roughly 5 to 10 percent of all cloud-to-ground strokes but carries substantially higher peak current. That burst of charge produces a rapid change in the electric field above the cloud, and the mesosphere responds. The nitrogen molecules in that thin air are excited to luminescence. They glow red. The event propagates upward at speeds measured at up to 10,000 kilometers per second — fast enough to cross the distance from New York to London in under half a second. The entire flash lasts between 3 and 10 milliseconds. A human blink takes roughly 150 milliseconds.
The atmosphere is not a passive medium. It is a layered electrical system, and a single storm below can trigger responses in regions of sky so high that the air there has more in common with the edge of space than with the weather at the surface. The storm is the generator. The mesosphere is the other terminal. The circuit closes in the wrong direction.
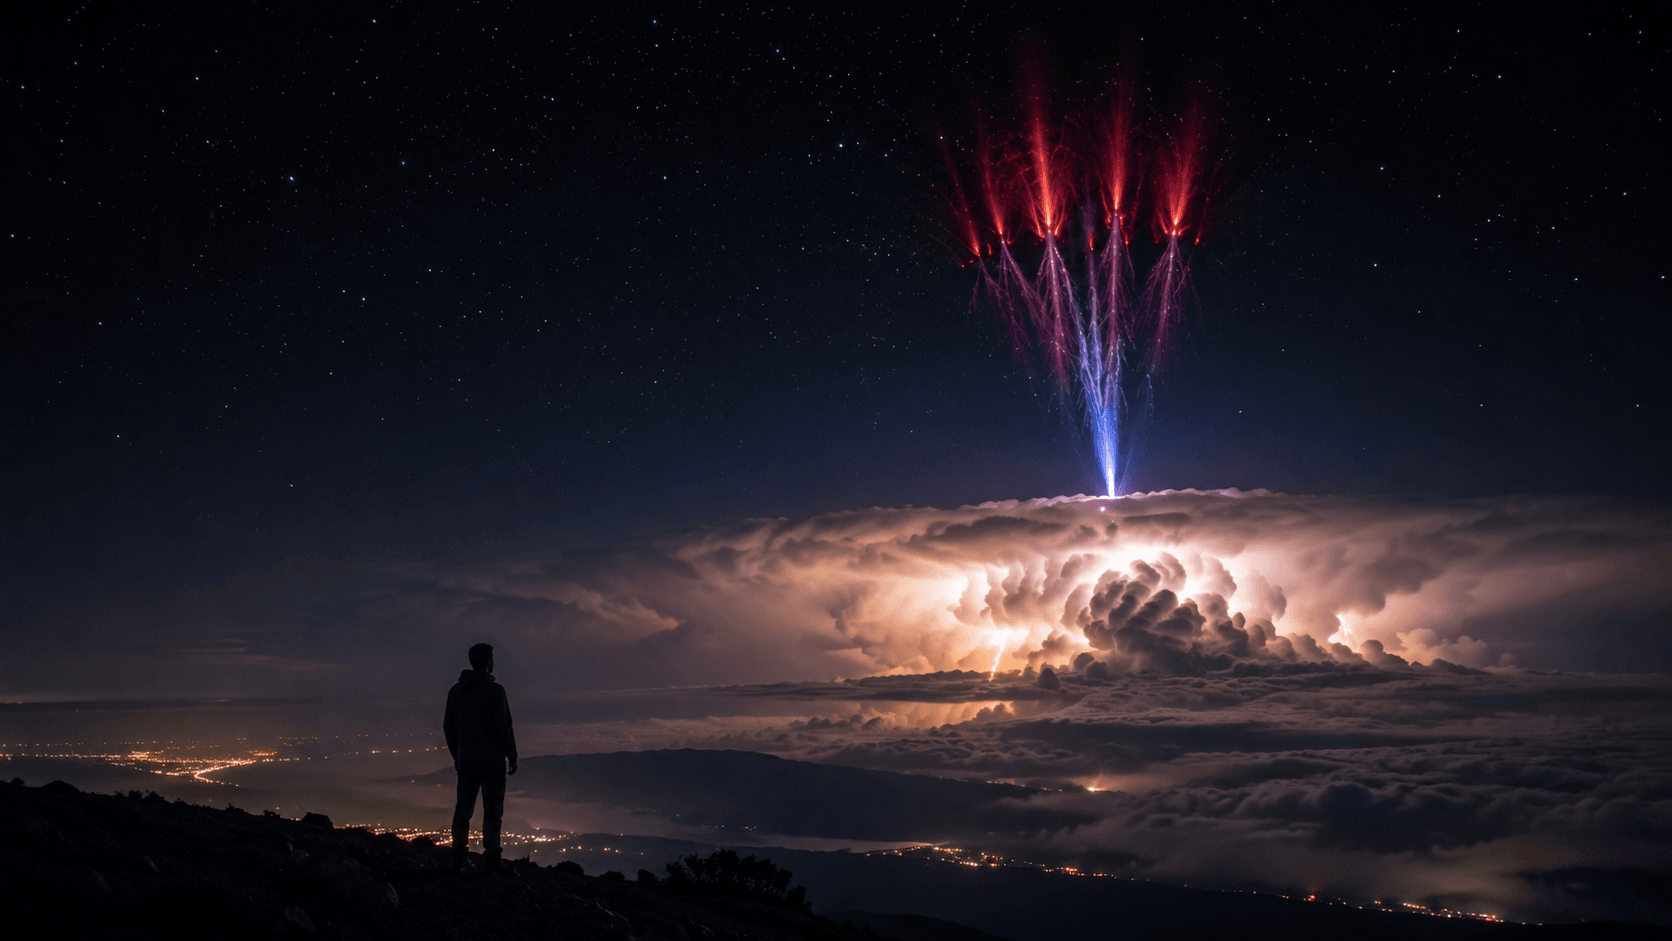
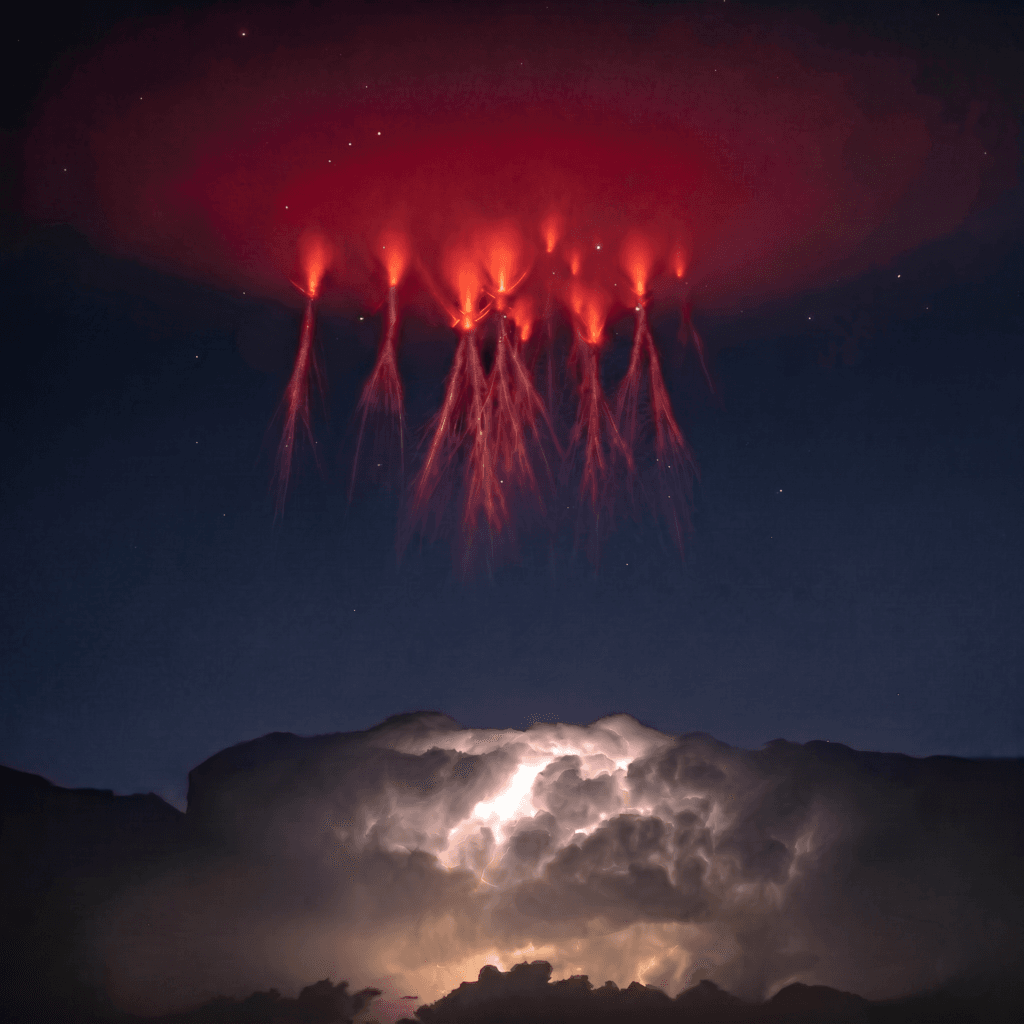
The structure is not random — it is layered, each luminous column marking a discrete discharge event in the mesosphere, organized by air density: thinner above, denser below, the physics of the atmosphere made briefly visible in red light above the storm that triggered it.
Source: ESA / NASA — Transient Luminous Event Photography, Public Domain
From the Surface, You Cannot See This — The Geometry Is Wrong
A sprite at 70 kilometers altitude, positioned directly above a storm, is hidden from anyone near that storm by the cloud tops themselves. To see above the anvil of a cumulonimbus, you need distance — the same reason a mountain range is invisible when you are standing at its base and clear when you are 200 kilometers away. Ground observers who successfully photograph sprites are typically positioned 200 to 500 kilometers from the triggering storm, watching it at a shallow angle over the horizon. At that distance, the storm fits in a frame. The sky above it is visible. And if the conditions are right — dark enough, the storm active enough, the camera sensitive enough — the sprites appear as faint red columns rising silently into the upper atmosphere.
From the International Space Station, the geometry reverses entirely. The ISS orbits at approximately 400 kilometers altitude, above the sprites themselves. Looking downward toward a storm system, astronauts see the in-cloud lightning as a pulsing glow beneath a white anvil, and the sprites as flashes that move upward — toward the observer. Every intuition about the direction lightning travels is inverted. Crew members of ISS Expedition 44 captured the image below from orbit, and the visual logic of it is still disorienting: the storm below looks small, contained, manageable. The electrical event above it looks like something else entirely.
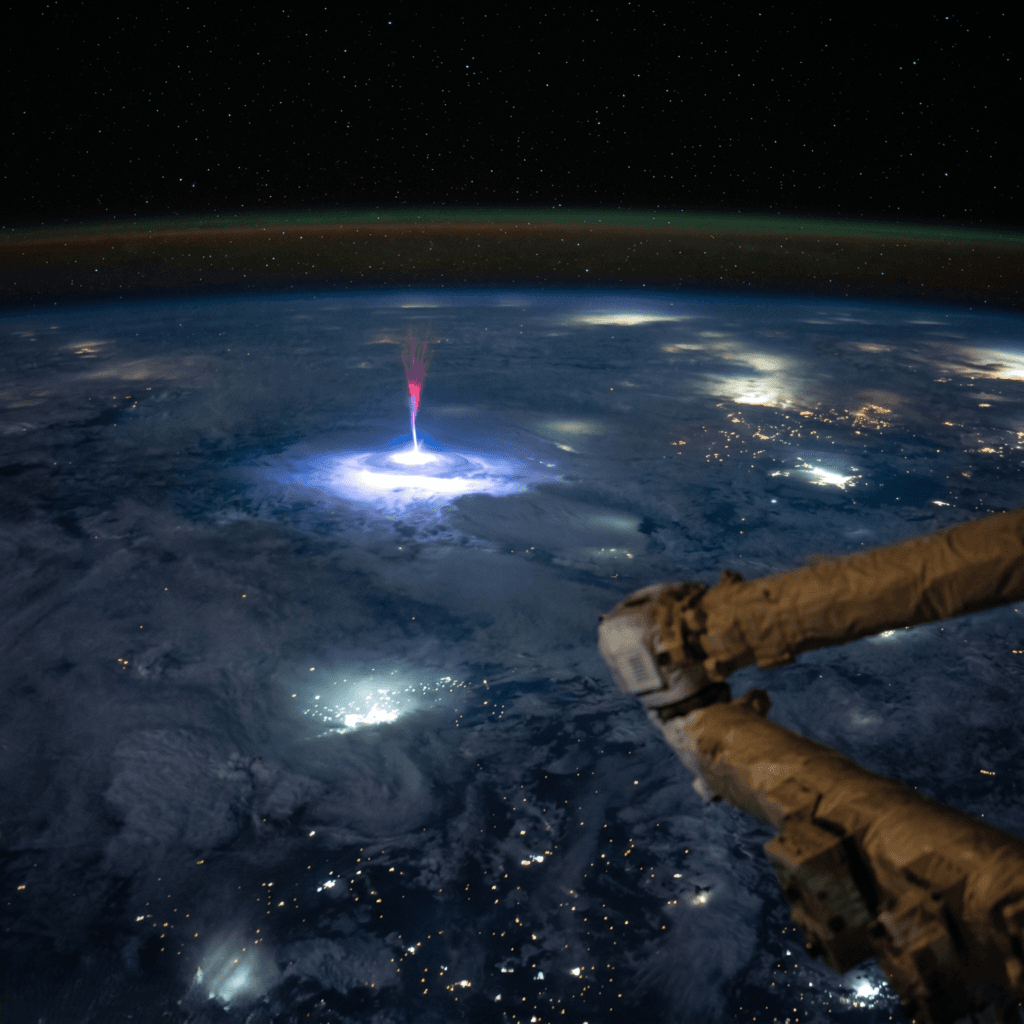
A red sprite and associated blue jet captured by ISS Expedition 44 crew from approximately 400 kilometers orbital altitude above a tropical storm system; from this vantage, the upward direction of the sprite is visually unambiguous — the discharge moves away from Earth, not toward it.
Source: NASA Johnson Space Center — ISS Expedition 44 Earth Photography, Public Domain
One Hundred Years of Correct Predictions Nobody Believed
C.T.R. Wilson published his theoretical prediction in 1925. Wilson was not speculating — he had already won the Nobel Prize in Physics for the cloud chamber, an instrument that made subatomic particles visible for the first time. His atmospheric calculations were rigorous. He predicted that large lightning discharges should produce optical emissions above the cloud layer, propagating upward into the upper atmosphere. The physics was sound. The problem was instrumentation: no camera available in 1925, or in 1945, or in 1975, was fast enough and sensitive enough to capture a 5-millisecond flash in low-light conditions at 60 kilometers altitude. Wilson’s prediction sat in the literature for 64 years, neither confirmed nor refuted.
During those 64 years, the reports accumulated. Pilots flying nighttime routes above or near large storm systems logged observations of brief flashes above the cloud tops. The accounts were consistent enough in their descriptions — brief, red or orange, above the storm, moving upward — that they were formally entered into aviation logs. They were not formally investigated. The institutional response, unspoken but effective, was that instruments had priority over witnesses, and instruments had not recorded anything. The burden of proof sat entirely with the person who had seen something, and that person had no camera capable of carrying it.
What this really reveals is a structural flaw that recurs throughout the history of atmospheric science: the absence of evidence was treated as evidence of absence, specifically because the instrumentation needed to find the evidence had not been built yet. Wilson was right in 1925. The pilots were right in 1960. The 1989 footage confirmed what the physics had always predicted. The delay was not scientific — it was logistical. And that distinction matters more than it is usually given credit for. Which raises the question that should make any thinking person uncomfortable: how many things that we currently dismiss as impossible are simply waiting for an instrument that does not exist yet? In an age when AI systems are rewriting what measurement means, the honest answer is that we do not know. We never have.
What You Are Actually Looking At When You See a Sprite
The branching structure of a red sprite is not random. The main body — the luminous column at altitude — is where the nitrogen emission is strongest, because the air at 70 to 80 kilometers is thin enough to allow long electron mean free paths, meaning electrons can travel far between collisions and the resulting light emission is intense and diffuse. Lower in the sprite, the air is denser, the collisions more frequent, and the structure narrows into the finer tendrils that point back toward the cloud. The visual effect from a distance resembles a jellyfish, with a compressed body above and trailing filaments below. Some researchers describe specific morphological types: “carrot sprites,” which are compact and tapered; “column sprites,” which are narrow and vertical; and “jellyfish sprites,” which develop the full trailing structure. According to data from the ESA’s ASIM instrument, launched to the ISS in April 2018, jellyfish sprites are most commonly associated with the highest-energy positive lightning strokes.
The red color is specific. It is not an artifact of photography or atmospheric scattering. Molecular nitrogen in its excited state emits photons predominantly in red and near-infrared wavelengths — the same physical process that makes neon signs red, scaled up to a column of atmosphere 50 kilometers tall. At the lower, denser edges of larger sprite events, instruments have recorded a faint blue fringe corresponding to ionized nitrogen at slightly higher collision rates. The color is the atmosphere’s own emission signature. The atmosphere is, briefly, generating its own light in response to an electrical event that began far below it.
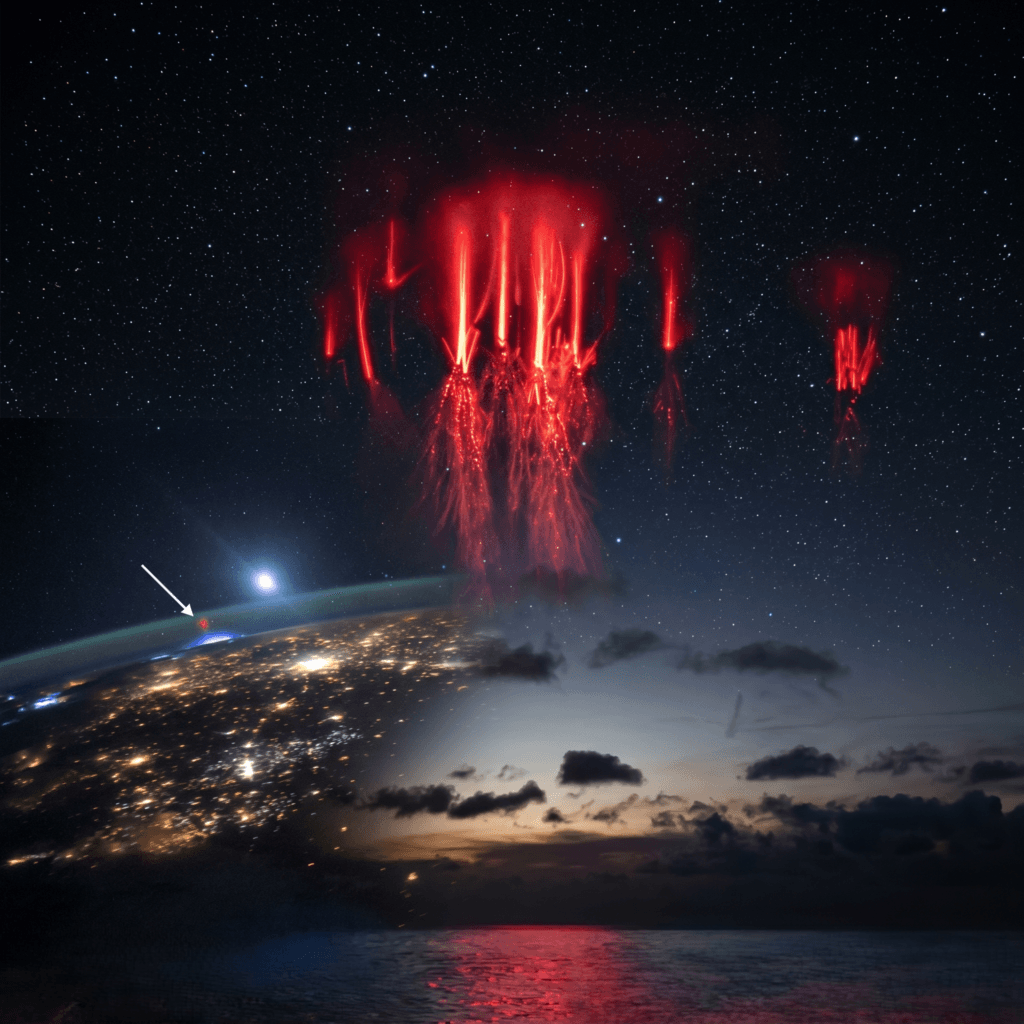
Red sprites photographed from high-altitude observation above the ocean, with the Earth’s curved limb and city lights visible below — the sprites extend from cloud level toward space in a vertical span that exceeds the altitude of most weather monitoring satellites, illustrating the true scale of what a ground observer can never see from beneath the storm. This is not simply light — it is a measurable electrical response extending into the upper atmosphere.
Source: ESA / NASA — Transient Luminous Events Observation Program, Public Domain
The Honest Limits of What Science Has Actually Confirmed
The basic mechanism is not in dispute. The positive lightning trigger, the nitrogen excitation, the altitude range, the propagation direction — these are established. What remains open is whether sprites have a measurable effect on the electrical balance of the global atmosphere, and whether the energetic electrons produced during sprite events influence nitrogen oxide concentrations in the mesosphere at climatologically significant levels. Research teams have proposed that this interaction could affect ozone chemistry at mesospheric altitudes, but the scale of the effect and its relationship to global climate remain active areas of investigation. The ESA ASIM mission was still collecting data through 2025, and the published results to date describe the phenomenon rather than fully explaining its downstream consequences.
There is also the matter of the broader family of transient luminous events to which sprites belong. Elves — an acronym for Emission of Light and Very Low Frequency perturbations due to Electromagnetic Pulse Sources — appear as expanding rings at 90 kilometers altitude and last less than a millisecond. Blue jets shoot upward from cloud tops in narrow columns reaching into the stratosphere. Gigantic jets have been documented extending from cloud tops to the ionosphere in a single discharge. Trolls appear briefly below sprites as short red columns. The full taxonomy of upper-atmospheric electrical phenomena was essentially constructed from scratch after 1989, and new observation campaigns continue to add events that complicate the existing categories. The current picture is more complete than it was, and less complete than it appears.
This raises a direct question worth sitting with: if a phenomenon occurring several hundred times per minute globally went undocumented until 1989, and if the systematic monitoring infrastructure to study it was not deployed until 2018, what portion of the current scientific understanding of atmospheric electricity is similarly incomplete? The answer is not reassuring, and pretending otherwise would be a disservice to the reader.
The View That Changes Everything — Seen From Space
The image that finally reframed how researchers talked about sprites was not a ground photograph. It came from orbit. ISS crew members, during routine nighttime photography of the Earth’s surface, began capturing sprite events with increasing frequency as camera technology improved. The orbital geometry that makes sprites invisible from below — the cloud tops blocking the view — makes them sharply visible from above. From 400 kilometers, the storm system is fully exposed. The cloud top is a flat white anvil. The sprite rises from it in a thin red column, extending toward the camera, toward space. Below the anvil, the interior of the storm pulses with ordinary lightning. Above it, the sprite fires in the opposite direction, in a different color, in response to a different electrical mechanism.
The visual compression of scale is what changes the understanding. At ground level, a sprite at 70 kilometers altitude is an abstract number. From orbit, the 70 kilometers between cloud top and sprite apex is a visible distance above a visible storm above a visible continent. The proportions become concrete. The storm below, which might cover several hundred kilometers of surface area and contain enough energy to drive multiple tornadoes, looks small compared to the electrical event above it. The sprite, in the ISS photographs, does not look like a weather phenomenon. It looks like a response — the atmosphere answering a charge from below with a discharge of its own, directed away from the planet that generated it.
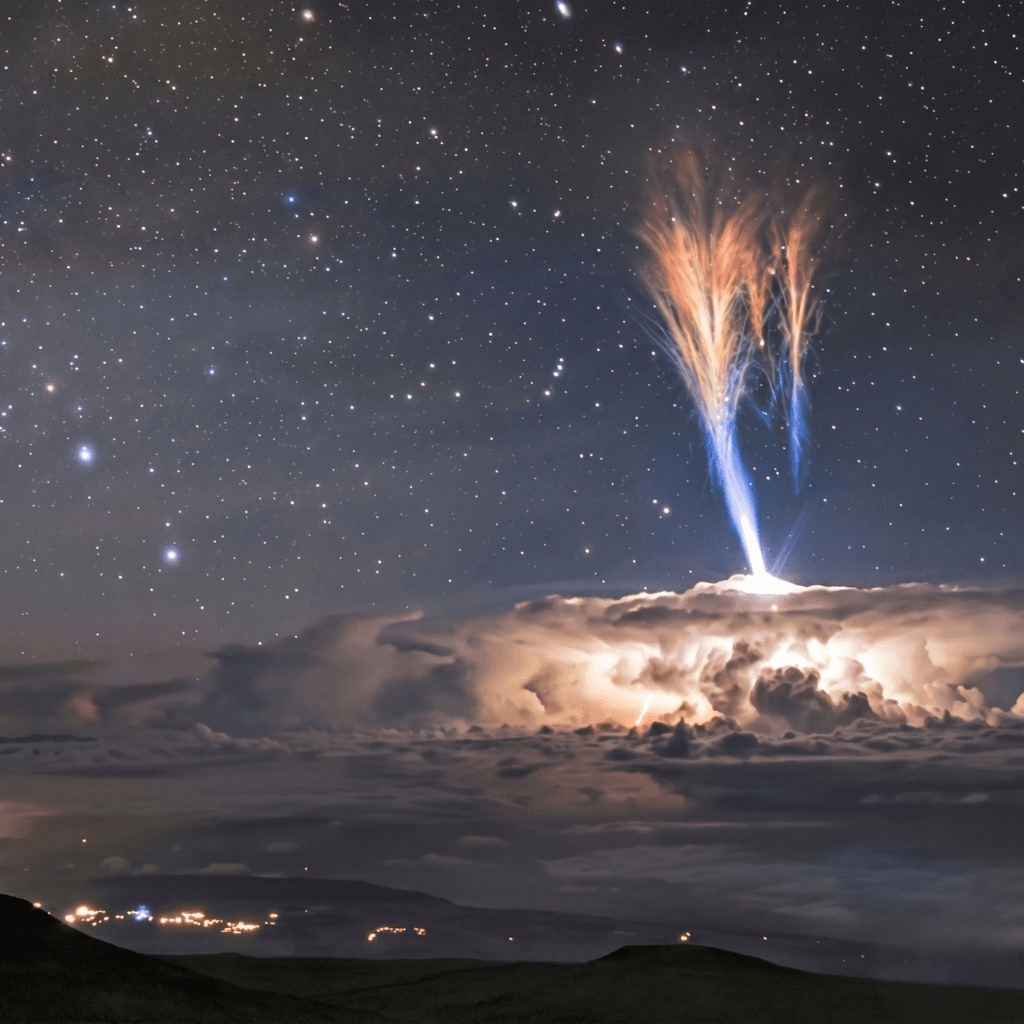
A blue jet and red sprite captured simultaneously from ground level above a distant cumulonimbus anvil under a clear starfield — the blue column originates at the cloud top while the red structure fans outward above it, two distinct transient luminous events at different altitudes triggered by the same storm system, both invisible to anyone sheltering below those clouds.
Source: ESA / Wikimedia Commons CC0 — Transient Luminous Events Documentation
Frequently Asked Questions
Q. Are red sprites visible to the naked eye from the ground?
A. Under the right conditions, yes — but rarely and with difficulty. Successful visual observation requires positioning 200 to 400 kilometers from an active thunderstorm, a clear dark horizon toward the storm, and complete dark adaptation of the eye. The events are brief enough (3 to 10 milliseconds) that deliberate watching is required rather than casual observation. Most documented naked-eye sprite sightings come from experienced observers specifically watching for them. Photography is substantially more reliable than visual detection because long-exposure frames accumulate the faint red light that the human eye processes poorly at low intensities.
Q. How is a red sprite different from a blue jet?
A. They are distinct phenomena. Blue jets originate at the cloud top and propagate into the stratosphere, reaching roughly 40 to 50 kilometers, driven by in-cloud electrical processes. Red sprites originate higher, in the mesosphere, triggered by large positive cloud-to-ground strokes. According to ESA ASIM mission documentation, both belong to the transient luminous event category but are physically distinct in excitation mechanism and spatial extent.
Q. Why did it take until 1989 to document something that happens hundreds of times per minute?
A. Three factors combined to produce the delay. First, the events last 3 to 10 milliseconds — fast enough that standard film and early video cameras, which record at 24 to 30 frames per second, would require extraordinary luck to capture a sprite in a single frame. Second, the geometry of observation from the ground requires specific positioning well away from the storm, which limits the number of observers in the right location. Third, the red emission spectrum is poorly matched to the sensitivity of standard photographic film and early video sensors, which were optimized for visible and blue wavelengths. The 1989 capture used a low-light video camera with higher red-spectrum sensitivity than standard equipment of the period. The technology and the position aligned accidentally.
What You Now Know
Every major storm you have ever sheltered from was simultaneously generating electrical events in the upper atmosphere that you could not see, could not hear, and had no framework to imagine. The lightning going down was the visible portion of a circuit. The lightning going up was the rest of it. You were standing at the bottom of a system that extends almost to space, watching one direction.
Tip For Readers
The ESA ASIM mission publishes its transient luminous event datasets and imagery through the European Space Agency. NASA’s public image archive at NASA Images contains verified sprite photographs from ISS expeditions, all public domain, searchable under “sprite” or “transient luminous event.”
Verified Sources
NASA Johnson Space Center Earth Science and Remote Sensing Unit — ISS Transient Luminous Event Photography, Expedition 44 Archive, 2015
European Space Agency Human Spaceflight Directorate — ASIM Mission Science Results: Transient Luminous Events Classification and Occurrence Rates, 2020
American Geophysical Union Geophysical Research Letters — Positive Cloud-to-Ground Lightning and Mesospheric Optical Transient Initiation, peer-reviewed, 2018
NOAA National Severe Storms Laboratory — Transient Luminous Event Research Program: Ground Observation Methodology, 2003
University of Minnesota School of Physics and Astronomy — First Video Documentation of Red Sprite Events Above Thunderstorms, 1989