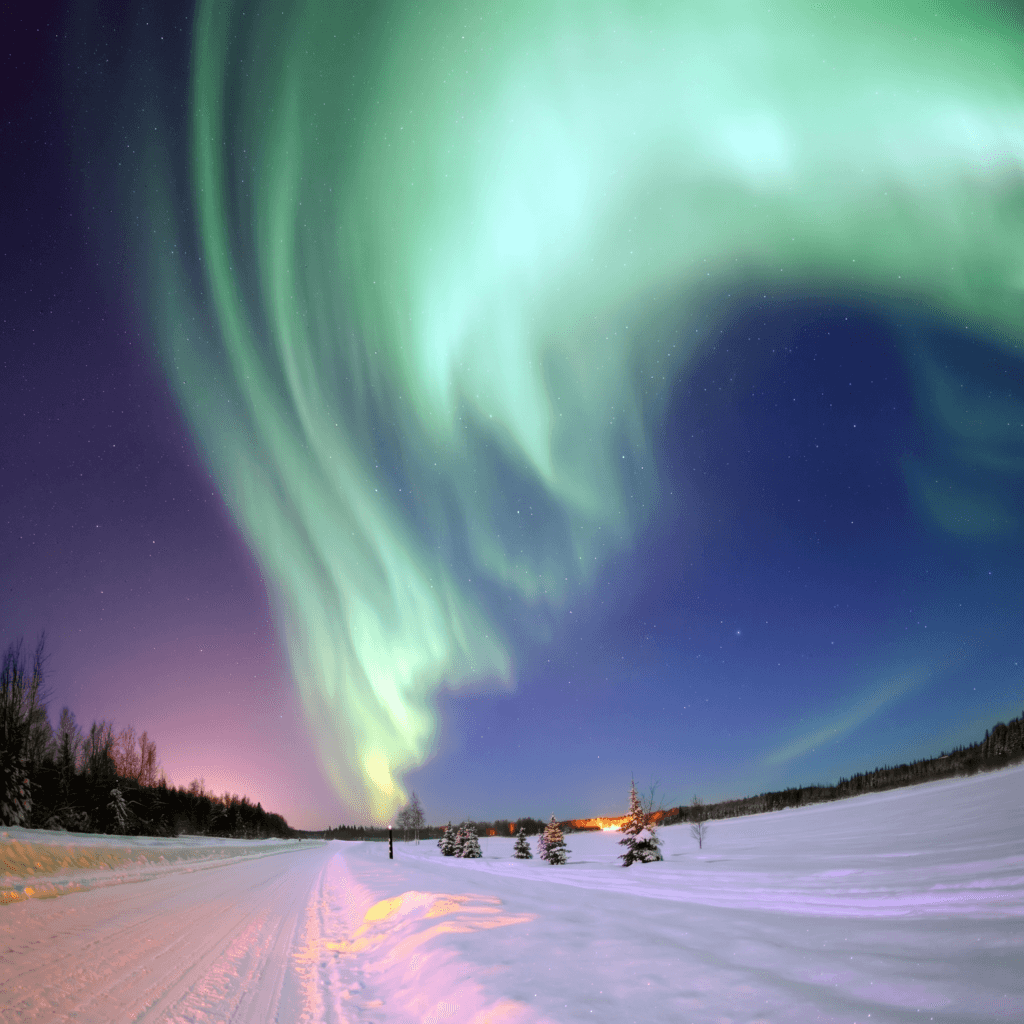
The sky over Quebec was green. Silent. Almost peaceful. Nobody panicked. Nobody ran. People just stood there, looking up, the way you do when something is too beautiful to question.
Ninety-two seconds later, six million people lost power. The entire provincial grid collapsed before anyone understood what was happening. The lights that caused it were still dancing overhead.
March 13, 1989. The aurora borealis put on a spectacular display — and triggered a blackout across Quebec, according to the NOAA Space Weather Prediction Center. The beauty and the damage were not separate. They happened together.
What the Green Light Is Actually Telling You
An aurora begins at the sun. Not at the sky — at the sun. The solar surface periodically releases coronal mass ejections: billions of tons of magnetized plasma moving toward Earth at speeds between 500 and 3,000 kilometers per second. Earth’s magnetic field deflects most of it. At the polar regions, where the field lines dip and funnel inward, some of that material gets through.
At altitudes between 100 and 300 kilometers, those particles collide with oxygen and nitrogen molecules. The collision transfers energy. The energy releases as light. Green aurora — the most common type — comes from atomic oxygen at roughly 100 kilometers altitude. The green light is not random. It is the visible result of particles colliding with the upper atmosphere.
Few understood they were watching a Kp 9 geomagnetic storm. It induced currents so powerful in the ground that nearby transformers simply failed. The 2013 Lloyd’s of London risk analysis estimated that a comparable event striking today’s infrastructure could cost between 600 billion and 2.6 trillion dollars in the United States alone. The green light is beautiful. Few people realize what it means.
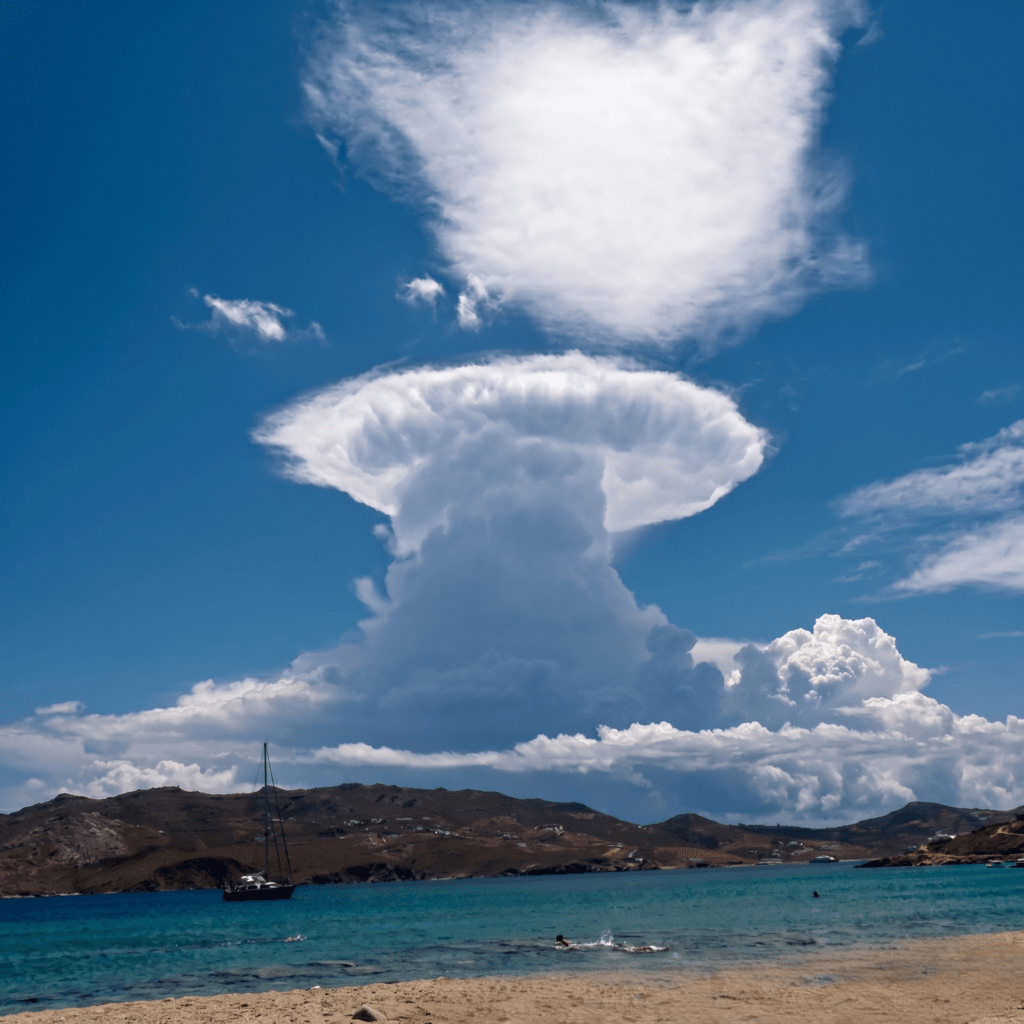
The Cloud That Hit a Ceiling — and Kept Pushing
Most people see a storm cloud and think: rain. What they are actually looking at is a heat engine.
When surface air heats faster than the air above it, it rises. Moisture condenses as it climbs, releasing latent heat. That heat drives the column higher. The process feeds itself — harder, faster, until the rising air hits the tropopause, the hard boundary between the troposphere and the stratosphere, sitting roughly 12 kilometers above sea level. There, it cannot climb any further. The air spreads outward and forms the flat anvil visible at the top of a mature cumulonimbus.
The NOAA National Severe Storms Laboratory documented updraft velocities surpassing 175 kilometers per hour inside supercell thunderstorms between 2010 and 2022. Inside that column, ice particles collide and separate electrical charge across vertical distance. When the differential exceeds what air can insulate, it discharges. In milliseconds, a single lightning bolt heats the surrounding air to approximately 30,000 Kelvin — a temperature hotter than the sun’s surface. The anvil top is the visible ceiling of that process. It is not just a storm cloud. It is a system turning heat into motion and electricity.
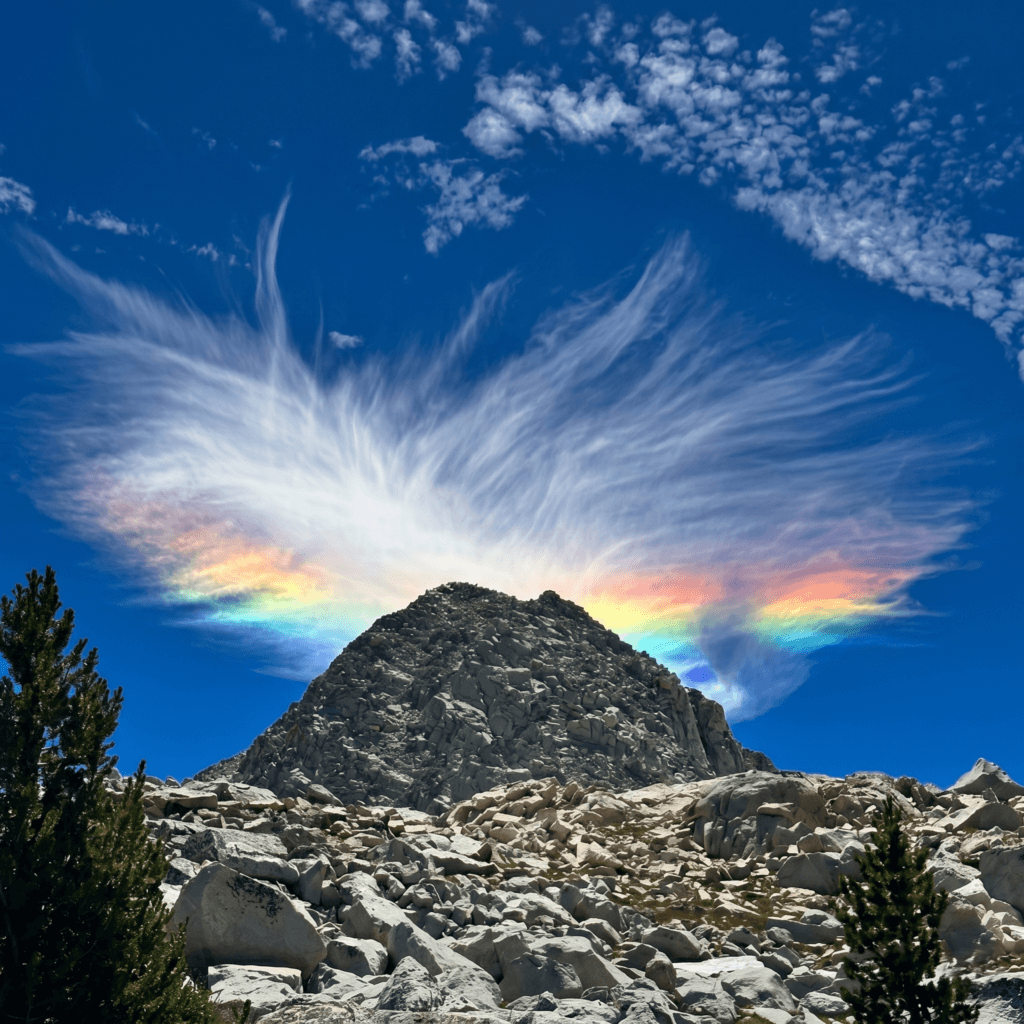
The Rainbow That Isn’t One
Look at the arc in the photograph. Your instinct says rainbow. Your instinct is wrong.
What sits above that granite peak is a circumzenithal arc — produced not by raindrops but by hexagonal plate-shaped ice crystals suspended in high-altitude cirrus cloud. A standard rainbow requires liquid water and appears opposite the sun. This arc requires ice and appears in a different part of the sky, produced by refraction through the flat horizontal faces of crystals too small to see. The physics is identical. The source material is not.
The NOAA Atmospheric Optics program has documented over 40 distinct optical phenomena operating on these principles — halos, glories, coronae, arcs. Many of these pass unnoticed above populated areas every day. The circumzenithal arc only appears when the sun sits below 32 degrees above the horizon. Higher than that and the geometry no longer directs the refracted light toward any observer on the ground. These conditions happen more often than people realize. Most pass unnoticed.
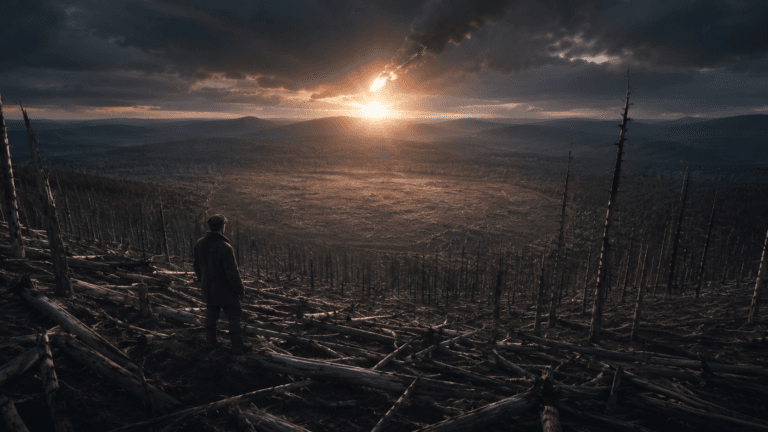
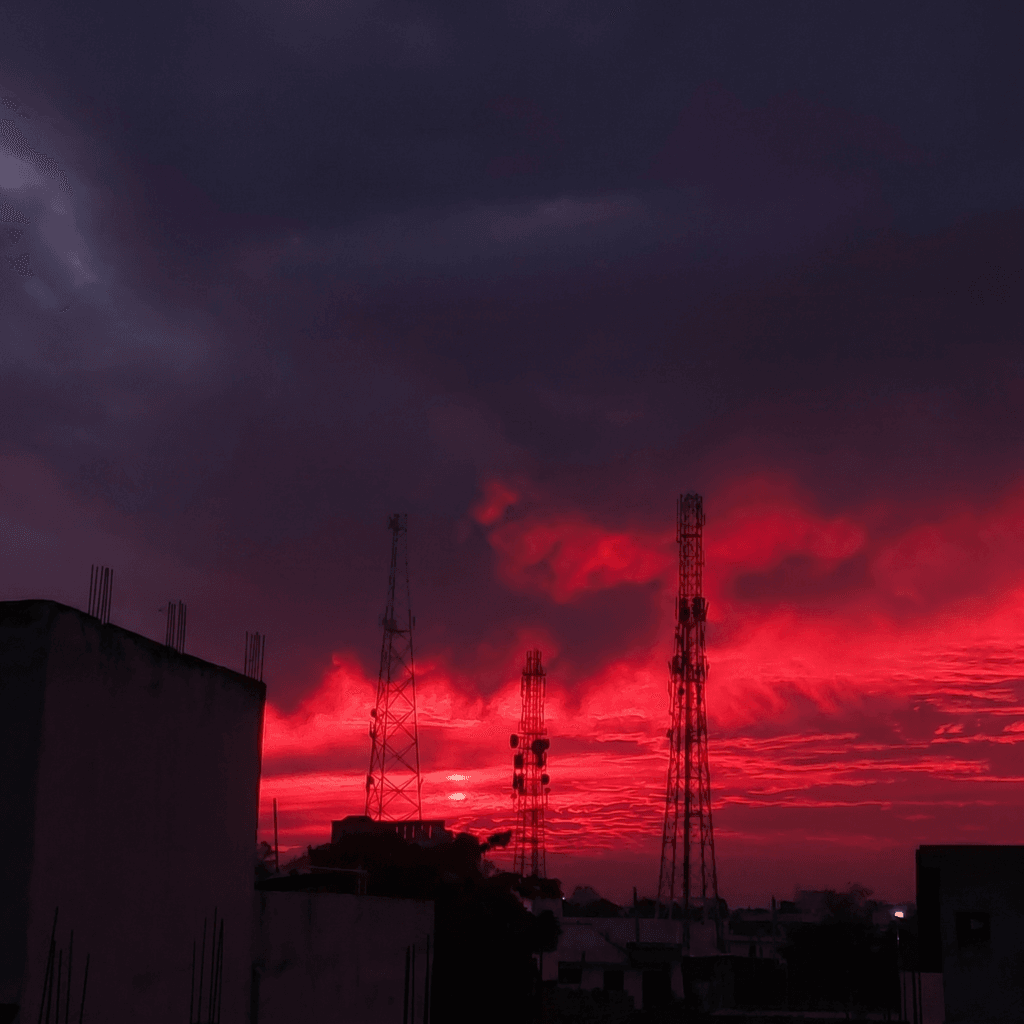
Red Means Something Burned
The sky in this photograph is not on fire. But something was — and recently enough that the evidence is still crossing the horizon.
When the sun sits low, its light must travel through roughly 40 times more atmosphere than at midday, according to NOAA Earth System Research Laboratories calculations. That distance is not neutral. Atmospheric molecules scatter shorter wavelengths — blue, violet — outward in every direction. By the time the light reaches your eye, most of the blue has scattered away. What remains are the longer red and orange wavelengths.
After Krakatoa erupted in 1883, stratospheric sulfur dioxide particles enhanced this scattering, causing crimson sunsets to be documented in areas like Norway for months. The same effect occurs with wildfire smoke, with volcanic ash, with heavy industrial particulate. A deep red sky is not just a color. It is a record of what the air has been carrying for the past several hours. The signs are there almost every evening. Most people never notice them.
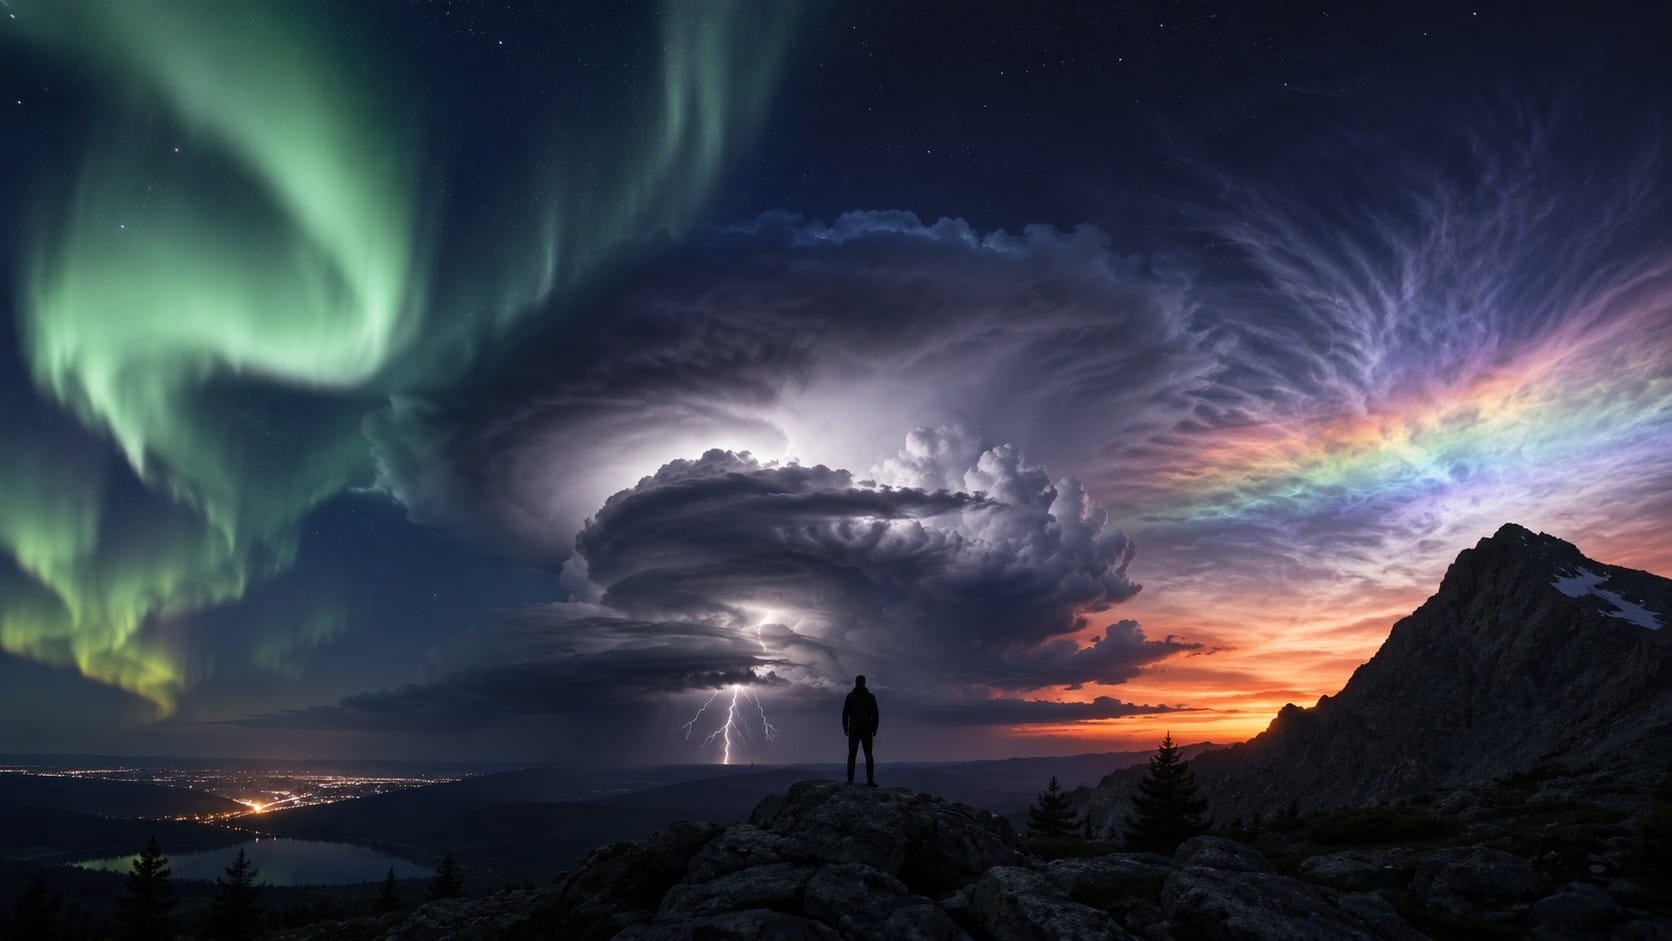
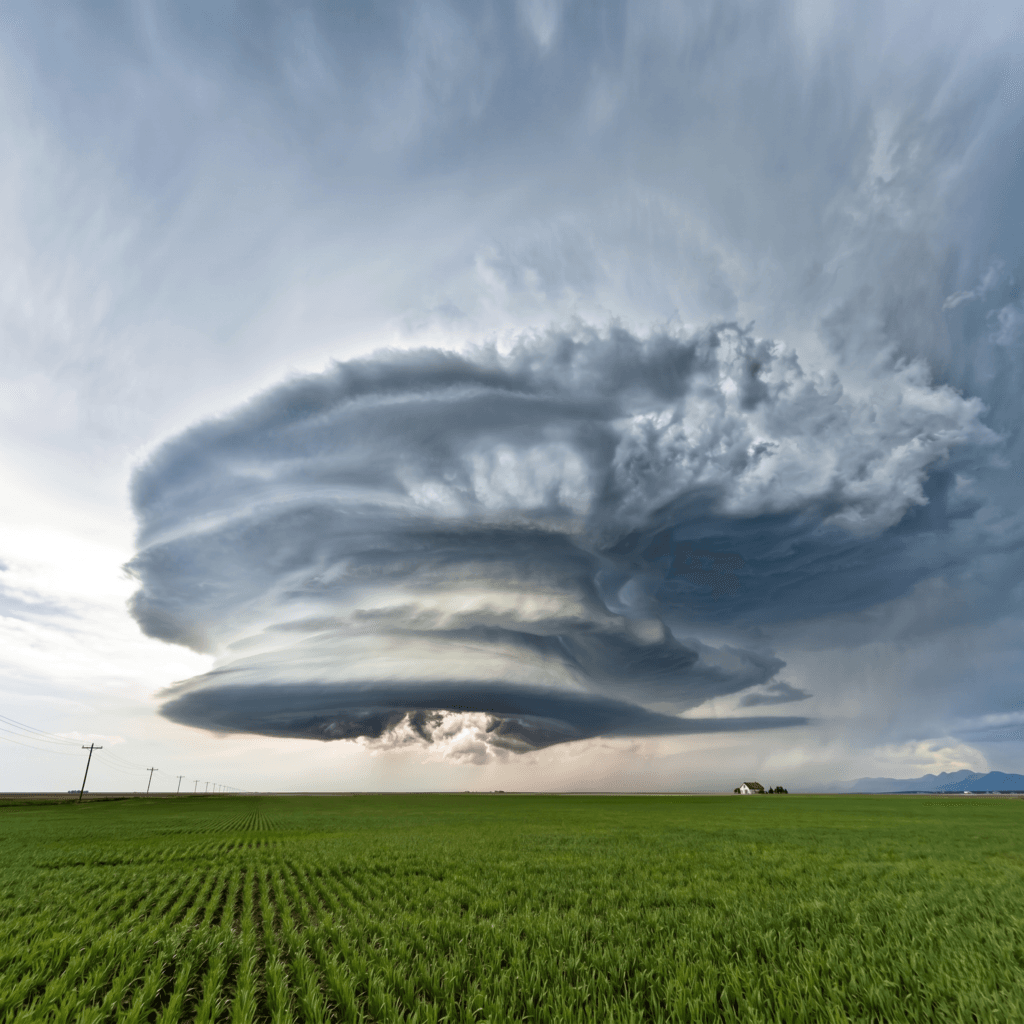
The Storm That Begins Rotating
There is a small house in the lower right corner of that photograph. It is still standing. For now.
What surrounds it is a supercell — not an ordinary severe thunderstorm, but a storm in which the entire updraft column has developed persistent, organized rotation. That rotation is driven by vertical wind shear: horizontal layers of air moving at different speeds, which tilt rotating air masses from horizontal to vertical as they are drawn upward. Each layered band visible in the image represents air at a different altitude being pulled into the system at a different velocity.
The NOAA Storm Prediction Center recorded 1,376 confirmed tornadoes in the United States in 2023 alone, the majority associated with supercell activity. The 2011 Joplin, Missouri tornado — produced by a supercell meteorologists had tracked for over an hour — killed 158 people and carved a damage path 35 kilometers long. Peak winds exceeded 320 kilometers per hour. The pressure change was powerful enough to damage structures beyond ordinary wind impact. Watching that formation from a distance raises a difficult question: how much of what you are seeing is information, and how much is just weather, indifferent to whether you understand it or not?
What the Sky Will Not Tell You on Its Own
Every phenomenon described here carries a limit worth stating plainly. The aurora does not always precede a blackout. A red sky does not always mean Krakatoa. A supercell does not always produce a tornado. The sky shows what is happening. Understanding it requires context.
The “red sky at morning, sailor’s warning” maxim has genuine meteorological grounding. Low-pressure systems tend to move eastward, and a red morning sky suggests moisture-laden air approaching from the west. But it is a heuristic built for a specific geography and a specific century, and it fails outside those conditions. Modern numerical weather prediction — run by NOAA’s National Centers for Environmental Prediction using physics-based models updated continuously with real observational data — replaced that intuition not because it was useless, but because it was incomplete. The sky you see is the output of a system. The inputs are accessible only through instruments. Drawing confident conclusions from visual appearance alone, without the surrounding data, is a kind of confidence that atmospheric scientists have spent decades working to correct.
Knowing this does not make the sky less worth watching. It makes it worth watching more carefully.
Archive Notes
Why does the aurora sometimes appear red instead of green?
Color depends on which gas is excited and at what altitude. Oxygen above approximately 200 kilometers emits red light. Green aurora comes from oxygen between roughly 100 and 150 kilometers. During the extreme geomagnetic storm of May 2024, red auroras were visible as far south as northern Africa and parts of Mexico — latitudes where the phenomenon is almost never observed. During the Carrington Event of September 1859, red and white auroras were reported by observers in Cuba, Jamaica, and Hawaii, the most equatorial aurora sightings in the historical record.
What actually separates a supercell from any other severe thunderstorm?
A supercell is defined by persistent, organized rotation throughout its updraft column — a structure called a mesocyclone. Ordinary severe thunderstorms lack this deep rotational organization. The NOAA Storm Prediction Center classifies supercells separately because they produce a disproportionate share of large hail, damaging straight-line winds, and significant tornadoes relative to how frequently they occur. The Moore, Oklahoma tornado of May 20, 2013 — tracked for over an hour before it touched down — carried peak winds of approximately 340 kilometers per hour and killed 24 people.
Can a circumzenithal arc appear at any time of day?
No. The phenomenon requires the sun to sit below approximately 32 degrees above the horizon. Above that angle, the geometry of refraction through horizontal hexagonal ice crystals no longer directs light toward an observer on the ground. It also requires cirrus cloud containing the right crystal orientation — common but not guaranteed. These two constraints together mean circumzenithal arcs appear most often in morning and late afternoon, more frequently at higher latitudes where solar elevation stays lower for longer periods.
What You Now Know
The sky over Quebec was green and silent. It was also, at that exact moment, destroying the electrical infrastructure of a province. Beauty does not always arrive without consequences. More often than people realize, they arrive together — and the only difference between seeing and understanding is whether you know what you are looking at.
Tip For Readers
The NOAA Space Weather Prediction Center publishes real-time geomagnetic storm alerts and aurora visibility forecasts updated continuously. If you want to know when the sky is operating at its most consequential — before the lights go out — that is where to look.
Verified Sources
NOAA Space Weather Prediction Center — Geomagnetic Storm Impacts and Aurora Science Overview, 2024
NOAA National Severe Storms Laboratory — Thunderstorm Basics and Severe Weather Research, 2023
NOAA Storm Prediction Center — Annual Tornado Statistics and Supercell Classification Report, 2023
NOAA Earth System Research Laboratories — Atmospheric Optics and Rayleigh Scattering Documentation, 2022
NOAA National Centers for Environmental Prediction — Numerical Weather Prediction Science Overview, 2022
Lloyd’s of London Emerging Risks Team — Solar Storm Risk to the North American Electric Grid, 2013
Image sources: Wikimedia Commons contributors / CC BY-SA 4.0 — Aurora borealis (Alaska), cumulonimbus anvil (Mediterranean), circumzenithal arc (Sierra Nevada), red sunset (urban skyline), supercell thunderstorm (Great Plains)